EnrichBuild / Work / MPD report automation
Case study · Oilfield services · Managed pressure drilling
Drilling reports that write themselves in under 60 seconds.
An Alberta MPD services company produced a technical analysis report for every well: surge analysis, rollover (displacement) data and an operations decision matrix for the rig crew. Engineers built each one by hand. We replaced the formatting work with a pipeline. The engineer fills one CSV, drops it in a shared folder, and a finished, branded PDF comes back.
Before
Hours of formatting per well.
- Each report was assembled by hand: numbers copied into tables, charts rebuilt in spreadsheets, and the layout fixed page by page.
- Reports looked a little different depending on who made them.
- When a mud weight limit changed after review, the whole report was redone, and old versions got overwritten.
- Engineering time went into formatting instead of analysis.
How it works
One file in. A finished report out.
- 01
Fill one CSV
Five sections: well parameters, distribution list, surge analysis, rollover data and the operations matrix. It's the only input the engineer touches.
- 02
Drop it in Drive
Into a shared Google Drive folder. No upload portal, no login, no email.
- 03
Validate
A watcher picks the file up within 30–60 seconds and checks every required section and field. Bad data produces a clear error log instead of a broken PDF.
- 04
Chart and assemble
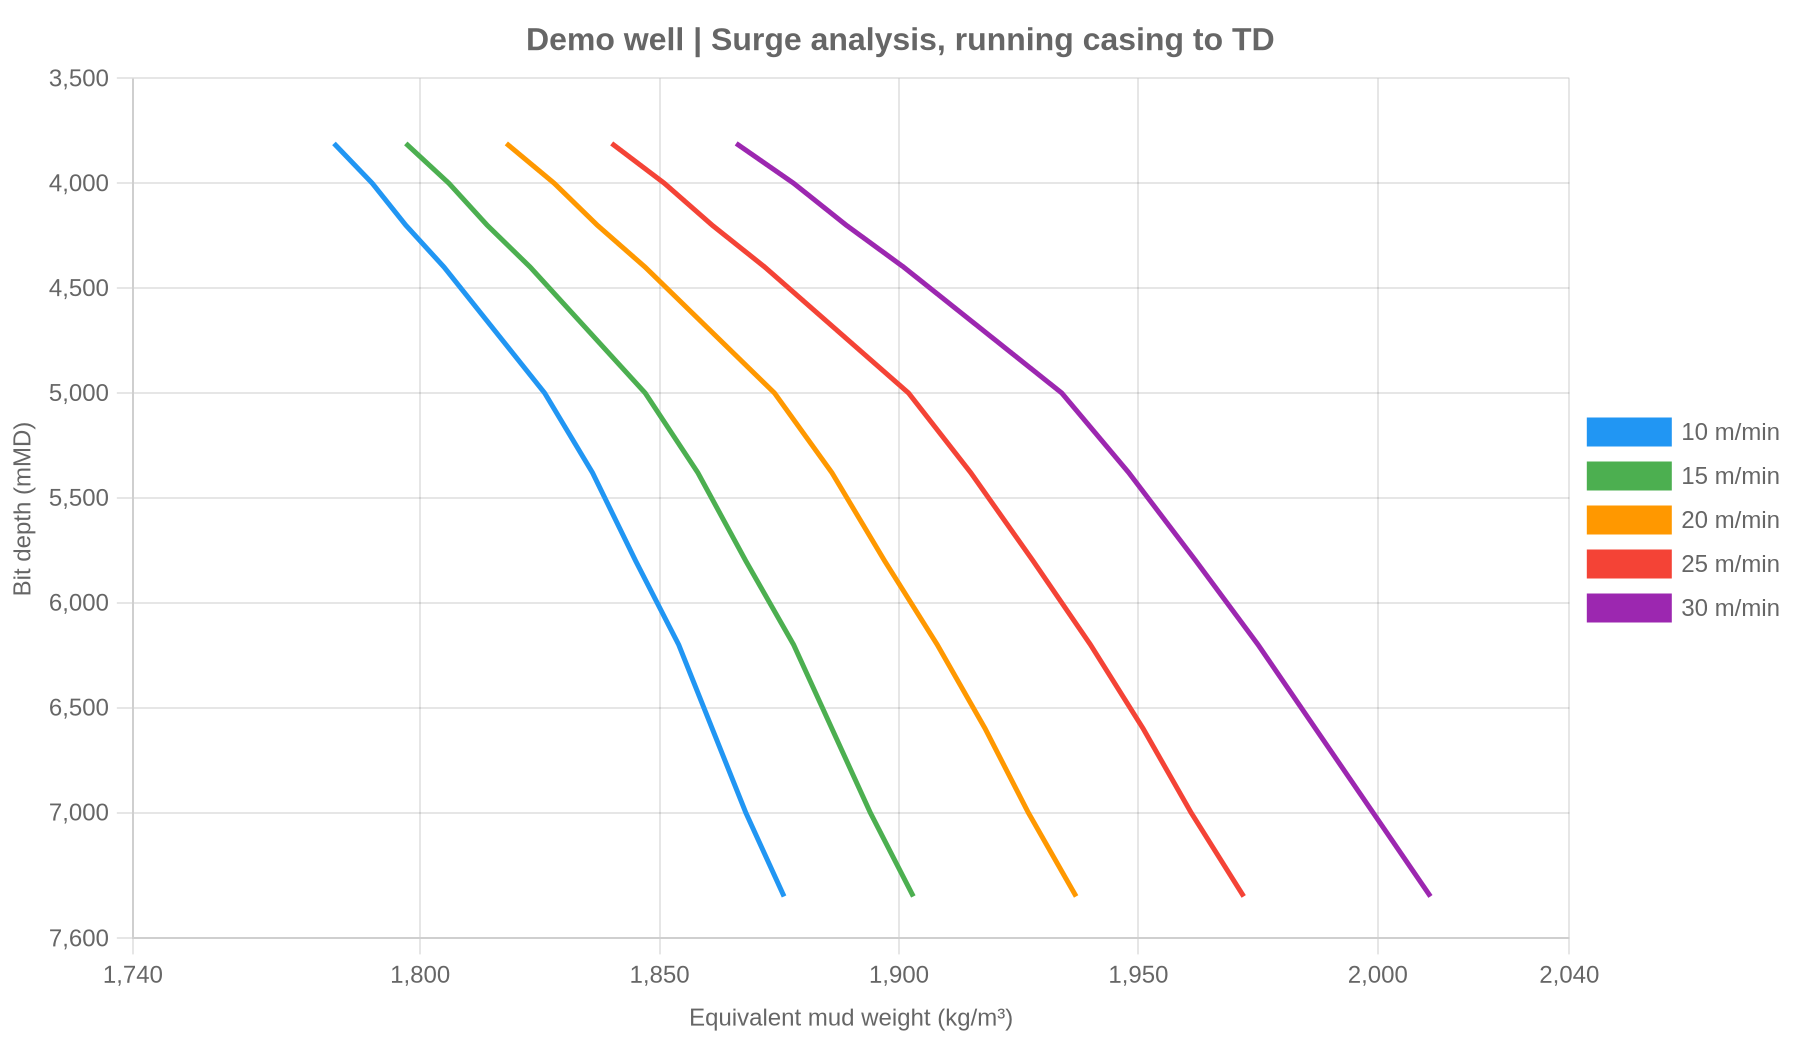
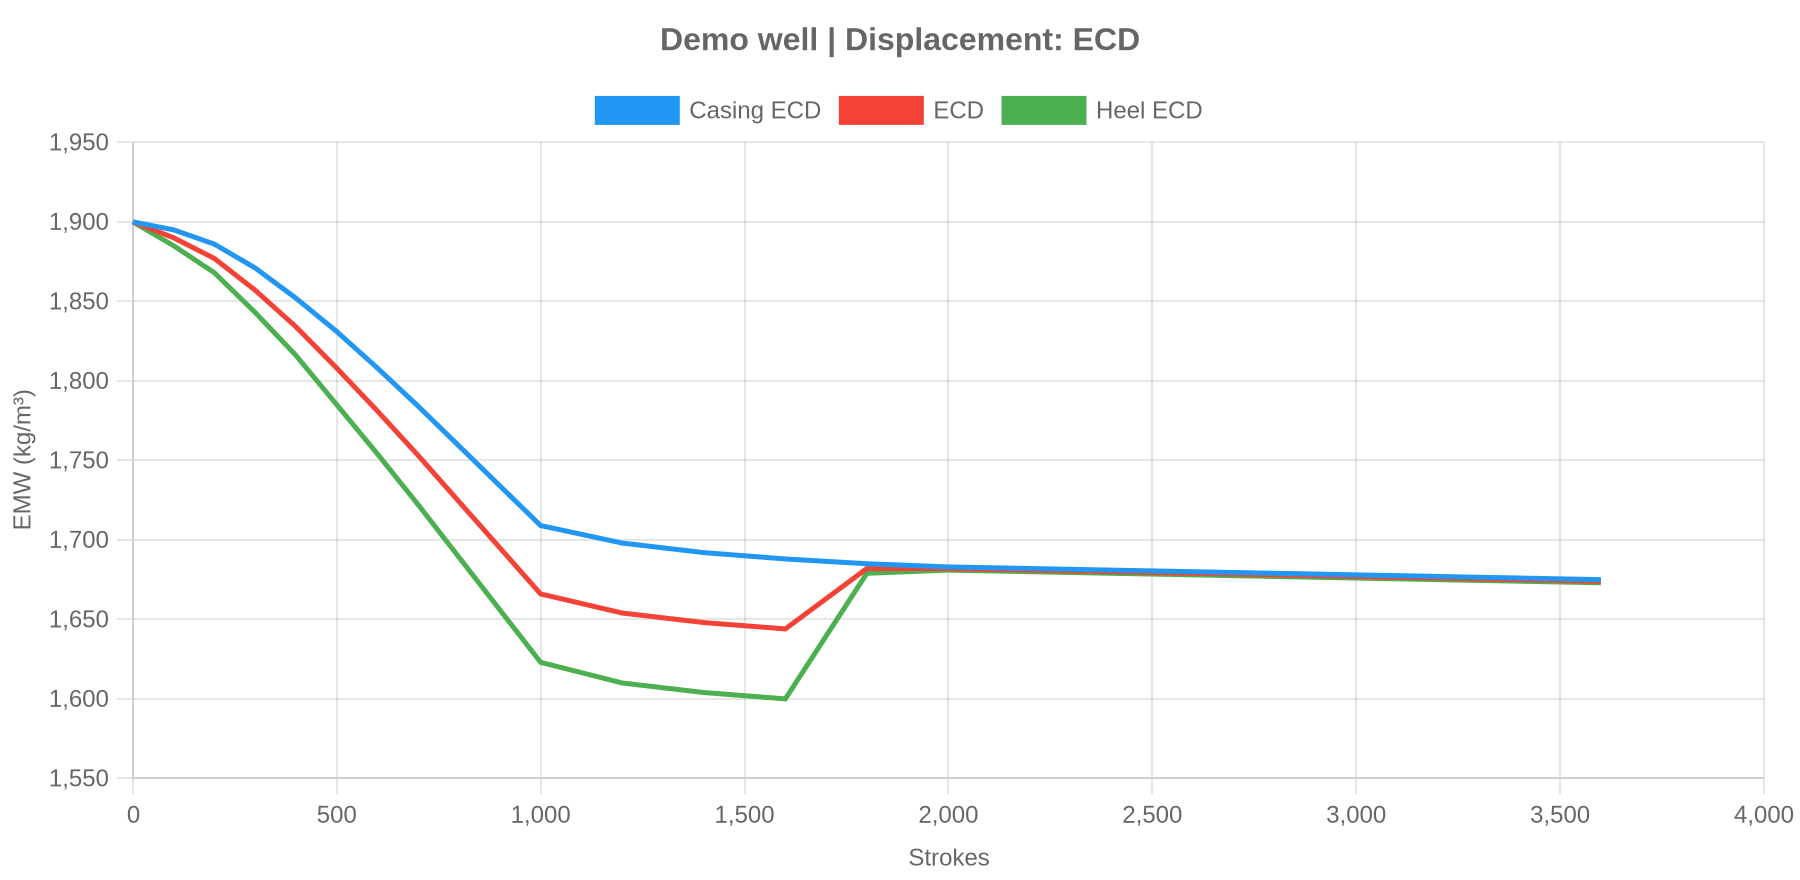
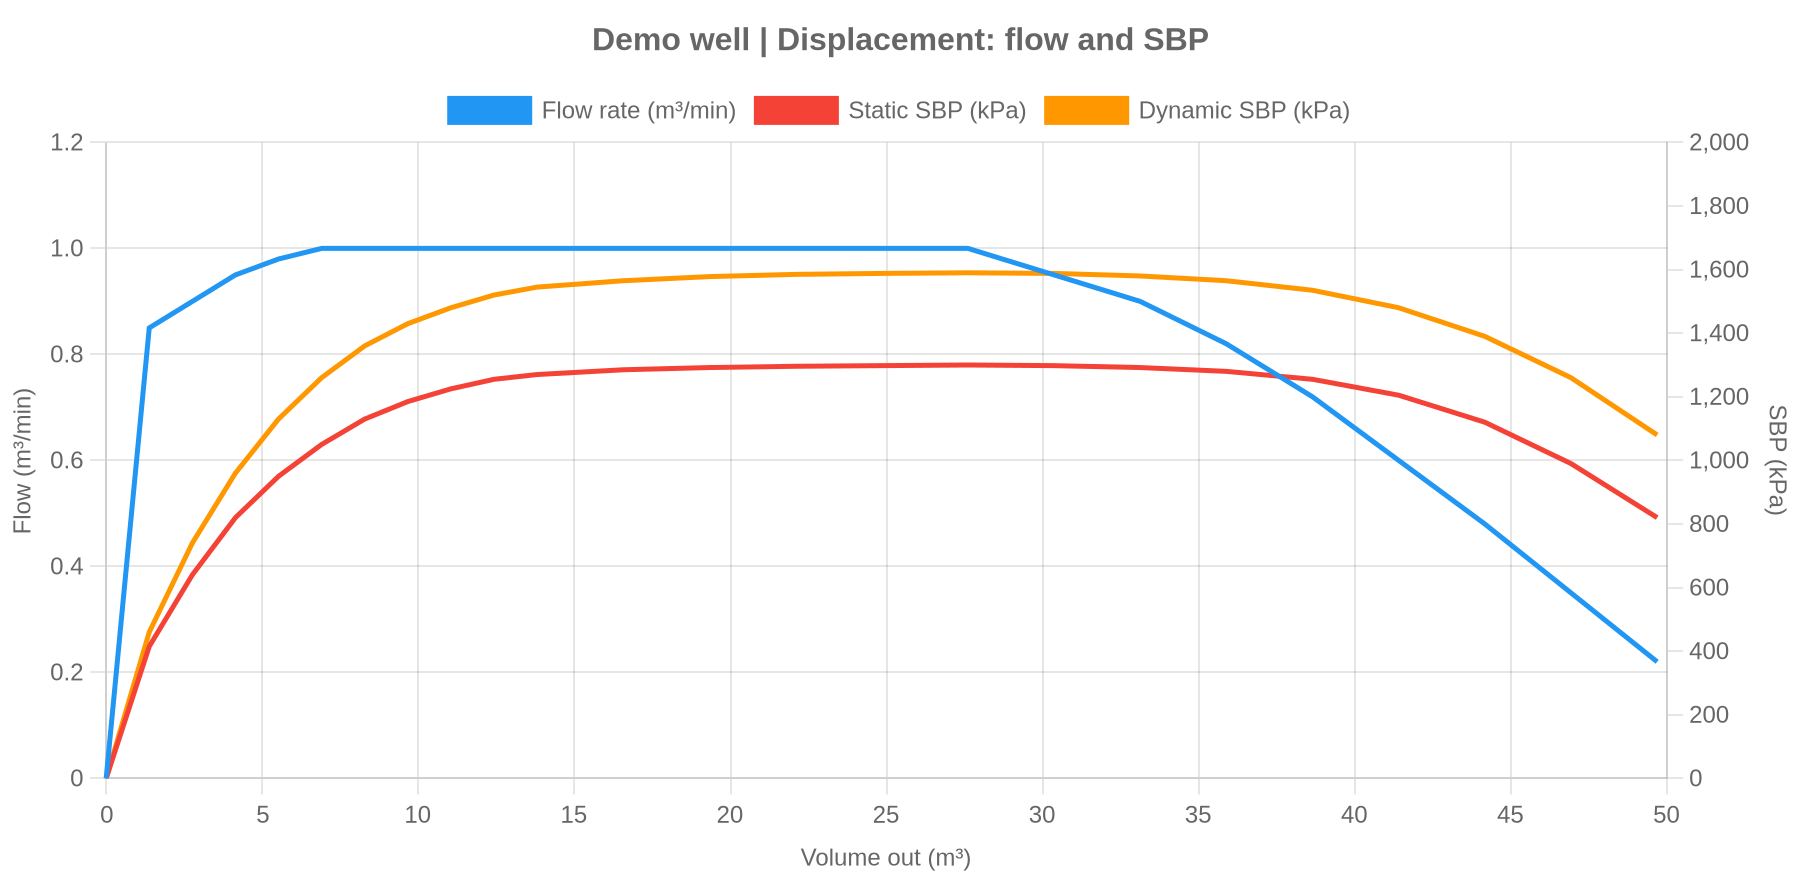
Surge, rollover ECD and flow/SBP charts are rendered from the data, then laid out with the tables into a branded 7-page PDF.
- 05
Deliver
The PDF lands next to the CSV, and a status file reads "COMPLETE – PDF ready". Dropping in v2 makes a new report and keeps v1.
The output
Charts generated straight from the data.
Rendered by the pipeline from a demo dataset. Client, well and crew details from real reports are never published.
What this proves about how we work.
We started with the engineer's real file and the report they already sent, not a new app for them to learn. The system checks its inputs, keeps every version, and fails loudly instead of quietly.
The same pattern (raw field data in, a finished document out) is how we build LEM tickets to invoices, daily drilling reports and the other seven systems.
Book a call
What report eats your engineers' week?
Send us the report you rebuild by hand every time. We'll show you what it looks like with one file in and the finished report out.
Book a 30-minute call[email protected] · Calgary, Alberta